GeoCanvas
Explore millions of rows of spatial data, together. Drop a dataset or ask in plain English and ship a live, shareable map in seconds — no GIS setup required.
Platform
geocanvas.dev
A complete mapping stack in the browser
rows on one map at full resolution — no downsampling
formats in and out: GeoJSON, CSV, Shapefile, GeoPackage
icons for marker styling
infrastructure to stand up
The problem
Teams behind location decisions have data with a "where" baked in — but a wall of rows tells them nothing. The traditional options: stand up a GIS stack measured in days, downsample big datasets until the map lies, or email screenshots back and forth and call it collaboration.
The solution
GeoCanvas puts the whole mapping stack in the browser: render, style, explore, and share large spatial datasets with no infrastructure. Files are auto-tiled on ingest and streamed at full resolution, aggregations run on an embedded analytics engine, and a shared link puts the whole team on the same live map.
Feature deep dive
Built on open standards — your data stays yours. Import and export GeoJSON, CSV, or Shapefile anytime; the map, the tiles, and the analytics come with you.
Ask a question, get a styled map
Describe what you want to see in plain English and GeoChat turns it into queries and styled layers against your data — powered by an embedded analytics engine, not a chatbot bolt-on.
A million rows, no downsampling
Drop in GeoJSON, CSV, Shapefile, or GeoPackage and GeoCanvas auto-tiles it for full-resolution rendering. Your whole dataset on one fast, fluid map — no sampling, no "too many features" errors.
Explore together, live
Share a link and your whole team explores the same map in real time: live cursors, presence, and follow-along. Maps stay private to your team until you publish — no public links by default.
Every layer type, styled
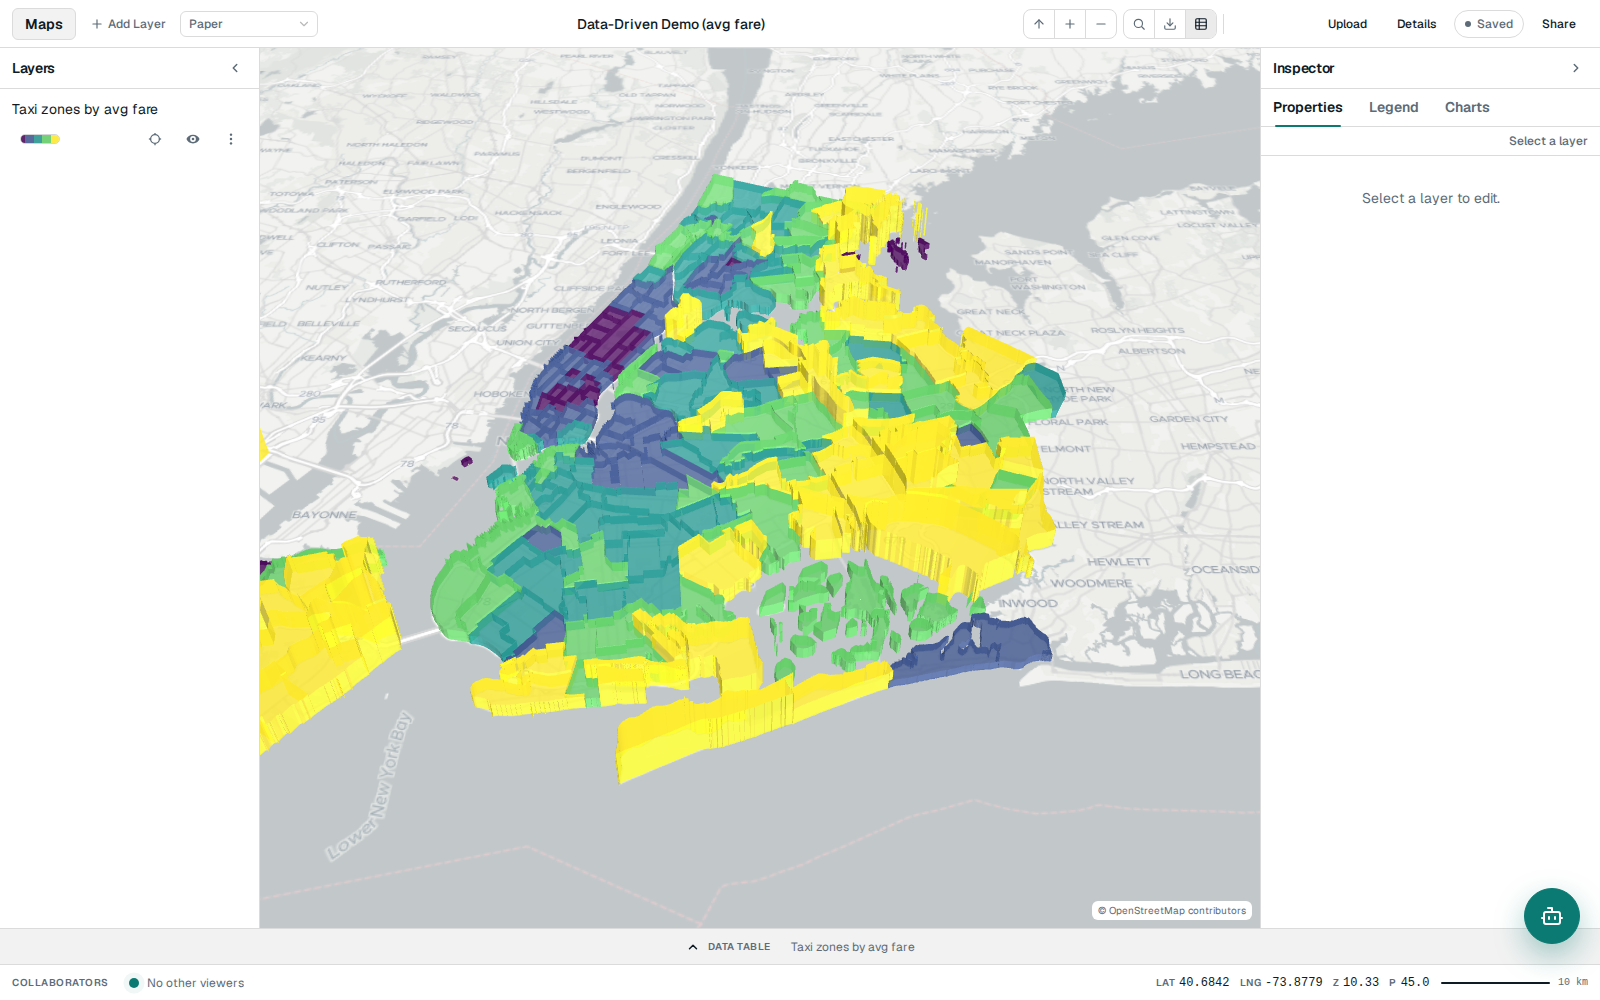
Heatmaps, hexbins, 3D extrusions, and vector tiles — with data-driven colors, automatic legends, a visual style editor, and 18,000+ icons for your markers. Export to GeoJSON, CSV, or Shapefile, or snapshot a publication-ready PNG with a scale bar.
Why GeoCanvas
For analysts
- From file drop to styled, shareable map in seconds — no GIS stack, no setup measured in days
- Ask questions in plain English; GeoChat answers them right on the map
- Aggregations run on an embedded analytics engine — heatmaps, hexbins, live counts
- Meets beginners where they are and scales up with power users: SQL, styling, legends
For teams
- Real-time multiplayer maps: live cursors, presence, and follow-along on one shared link
- Team-level access control — maps stay private until you publish them
- You own your data: export layers, tiles, and analytics at any time in open formats
- Per-seat pricing, not per-map — maps and data carry over when you upgrade
Put your data on the map
Bring a dataset too large for one view. Drop it in, ask it a question, and share the live map — all in your browser.
Visit GeoCanvas